2. From Emissions to Climate risk – Scientific Knowledge Base
This chapter is written by CICERO – the Center for International Climate Research1The chapter is written by CICERO Center for International Climate Research (hereinafter CICERO), and is dated 26 August 2020. Authors are Bjørn H. Samset and Marianne T. Lund. on commission from the Norwegian National Human Rights Institution (NIM).2A basic premise for discussions about the relationship between climate and human rights is an understanding of the scientific link between greenhouse gas emissions and climate change. Since NIM’s expertise is human rights, we have commissioned CICERO to summarise and explain the scientific knowledge base in Chapter 2 of the report. CICERO’s descriptions form the factual basis for our legal discussions in the rest of the report.
2.1. Introduction
The chapter summarises the scientific basis for linking greenhouse gas emissions and other man-made influences on the global climate to an increased risk of adverse and harmful effects on nature and society. The main source for the chapter is the Fifth Assessment Report from the Intergovernmental Panel on Climate Change (IPCC),3 Climate Change 2013: The Physical Science Basis. Contribution of Working Group I to the Fifth Assessment Report of the Intergovernmental Panel on Climate Change. Cambridge, United Kingdom and New York, NY, USA, Cambridge University Press (IPCC AR5 (2013)). as well as updates from three recent special reports.4 Global Warming of 1.5°C. An IPCC Special Report on the impacts of global warming of 1.5°C above pre-industrial levels and related global greenhouse gas emission pathways, in the context of strengthening the global response to the threat of climate change, sustainable development, and efforts to eradicate. World Meteorological Organization, Genève, Switzerland (IPCC SR15 (2018)); Climate Change and Land. An IPCC special report on climate change, desertification, land degradation, sustainable land management, food security, and greenhouse gas fluxes in terrestrial ecosystems. World Meteorological Organization, Geneva, Switzerland (IPCC SRCCL (2019)) and Ocean and Cryosphere in a Changing Climate. An IPCC Special Report on the Ocean and Cryosphere in a Changing Climate. World Meteorological Organization, Geneva, Switzerland (IPCC SROCC (2019)). Some recent scientific literature has also been used, with references in footnotes.
The chapter’s main conclusion can be summarised as follows:
Any human activity that changes the climate, locally or globally, from the State to which society and nature are currently adapted, can lead to an increase in climate-related risk. Natural variations, which are a part of the climate to which we are accustomed, make society relatively resilient against minor changes. In most places, however, human activity has already significantly changed the temperature relative to these variations.5Hawkins, et al., “Observed Emergence of the Climate Change Signal: From the Familiar to the Unknown,” Geophysical Research Letters vol. 47 (6) (2020). Continued climate impact, especially from CO2 accumulating in the atmosphere and thereby causing further warming in both the short and long term, therefore immediately contributes to exacerbating many types of climate risks. Climate risk is generally considered to increase in step with global warming and is, for instance, significantly greater at 2 degrees than at 1.5 degrees.6SR15 (2018). Climate change is already contributing to an increase in many types of climate risks, for both nature, society and people. Further emissions, including from Norway, will intensify this risk, both locally and globally.
In the following, we elaborate on and substantiate these conclusions.
2.2. Climate change, natural variability and climate risk
Climate change is now observed throughout the climate system, from deep down in the oceans to high up in the atmosphere. Today, around the year 2020, the global surface temperature is about one degree higher than in pre-industrial times.70.87 degrees for the decade 2006–2015, relative to 1850–1900, followed by four years all measured to be warmer than this average. See IPCC SR15 (2018) and WMO (2020). The trend over the past 50 years has been a global warming of just under 0.2 degrees per decade. This increase in temperature, and the recorded increase in the amount of CO2 in the atmosphere over the same period, has occurred very rapidly from a geological time perspective. The current level of CO2 in the atmosphere is also higher than it has been in a million years.8See illustration of development over time at the end of the chapter. Significant changes have also been measured across the climate system, including in the oceans (warming, sea level rises, acidification), on land (heat waves, extreme rainfall, tropical hurricanes) and in the frozen parts of the Earth (melting glaciers, ice loss in Greenland and Antarctica, Arctic sea ice decline, reduced snow cover during winter in the Northern Hemisphere).
Global warming, and the other climate changes, are mainly attributable to man-made influence, with only a small contribution from natural causes such as variations in solar radiation, volcanoes and cyclic changes in ocean currents. Of the man-made impacts, greenhouse gas emissions are by far the most forceful,9CO2, methane, nitrous oxide, ozone and synthetic gases; a total of around 1.5 degrees in recent model studies (Tokarska et al.,”Past warming trend constrains future warming in CMIP6 models,” Science Advances vol. 6 (12) (2020)). while emissions of aerosols (particles suspended in the air, such as soot, dust and sulphur compounds) in sum have a cooling effect, thereby so far keeping global warming somewhat at bay (cooling at around 0.5 degrees).10Tokarska et al. (2020); Samset et al, “Climate Impacts From a Removal of Anthropogenic Aerosol Emissions”, Geophysical Research Letters vol. 45 (2) (2018) pp. 1020-1029.
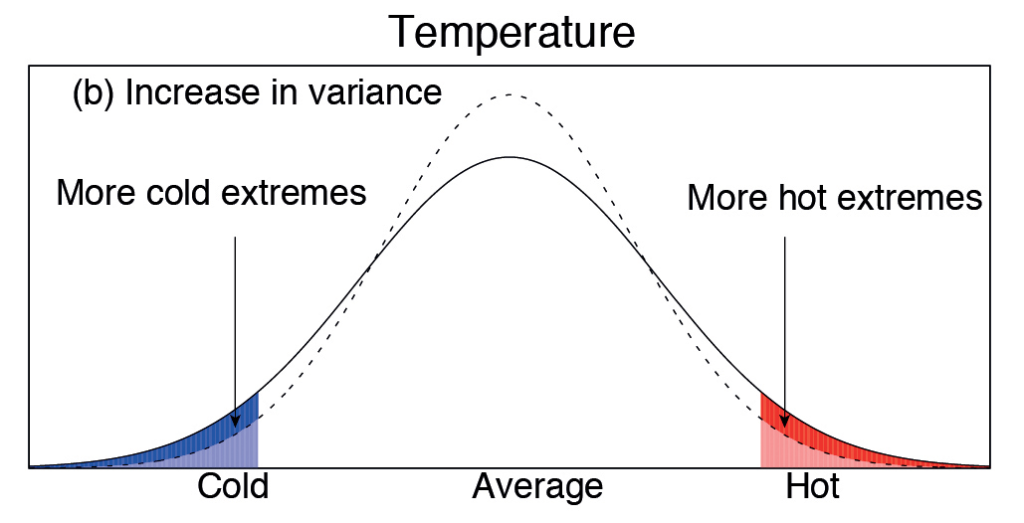
(IPCC AR5)The degree of natural variability, or how much temperature, precipitation and other parts of the weather normally vary from day to day, season to season and year to year, is as important a part of the climate as the average values. Nature and society are normally adapted to both. The amount of variability, however, is very different in different parts of the world, and is generally higher at high latitudes (as in Norway) than closer to the equator.11Hawkins, et al. (2020). At the same time, climate change occurs at different rates in different places. Warming also occurs faster in the north than near the equator, and faster on land than over oceans. For instance, an observed warming of between 3 and 5 °C has been reported from 1971 to 2017 at measuring stations in Svalbard.12Hanssen-Bauer, et al. (eds.), Climate in Svalbard 2100 – a, knowledge base for climate adaption, NCCS report no. 1 2019. Available on https://www.miljodirektoratet.no/globalassets/publikasjoner/M1242/M1242.pdf Climate change affects averages, but can also change variability. See Figure 1, which shows an example of how a warming and a simultaneous change in variability can lead to an increase in very hot days, while there are still as many cold days as before.
Society’s climate risk is mainly determined by three factors: the physical climate change (such as stronger heatwaves or more intense extreme rains), how exposed we are to the change (whether it happens in areas with high population density, or far out at sea), and how vulnerable we are to it (whether agriculture and infrastructure have already adapted to the changing climate, or whether conditions go beyond the limits of tolerance). Because natural variations will always occur on top of the average properties of the climate, even relatively small human-induced changes to the mean can lead to weather and climate events that are beyond those which society is familiar with and adapted to.13Hawkins, et al. (2020).
2.3. From emissions to climate change, in the short and long term
Recent research on the effect of climate change on nature and society shows that while a higher temperature is not the direct cause of all types of climate-related risks, the degree of global warming is nevertheless a good measure of the degree of climate risk. A central question is therefore how man-made emissions contribute to surface warming, in the short and long term. The physical processes linking emissions to warming are scientifically well established, and the remaining uncertainties about how strongly the climate responds to different types of emissions are limited.
Some types of emissions, such as soot, sulphur compounds and other forms of air pollution, have a direct impact on solar irradiance. The particles can reflect the solar radiation back into space (by themselves or by making clouds whiter), or absorb solar radiation before it reaches the Earth’s surface. The ground thereby cools quickly. Most of these emissions, however, remain in the atmosphere for only a few days. If, for instance, we removed all air pollution, the response of the climate would therefore in principle manifest within a few weeks to months. However, see the comments on the natural variability and inertia of the climate system further down.
An increase in the amount of greenhouse gases, as a result e.g. of the burning of oil, coal and gas, also has a rapid effect. A stronger greenhouse effect enhances the absorption of thermal radiation (heat) from the Earth’s surface, similar to the way a down jacket retains heat from the body. Like with a down jacket, however, it takes a little time for the full effect to be felt. If we abruptly doubled the amount of CO2, for instance, we could in the long term expect around 3 °C global of warming, according to the latest research.14Sherwood, et al., “An assessment of Earth’s climate sensitivity using multiple lines of evidence,” Reviews of Geophysics (2020). Around half of this warming would have occurred during the first decade, much of the remaining warming over the next hundred years, and then a small remnant on a millennial scale.15Ibid.
In reality, the greenhouse effect increases slightly each year as emissions continually increase (except in the pandemic year 2020), which in turn contributes to increased warming. The warming we register today, from year to year, is the sum of all these consecutive influences over time on climate, combined with natural variations from year to year of a few tenths of a degree.
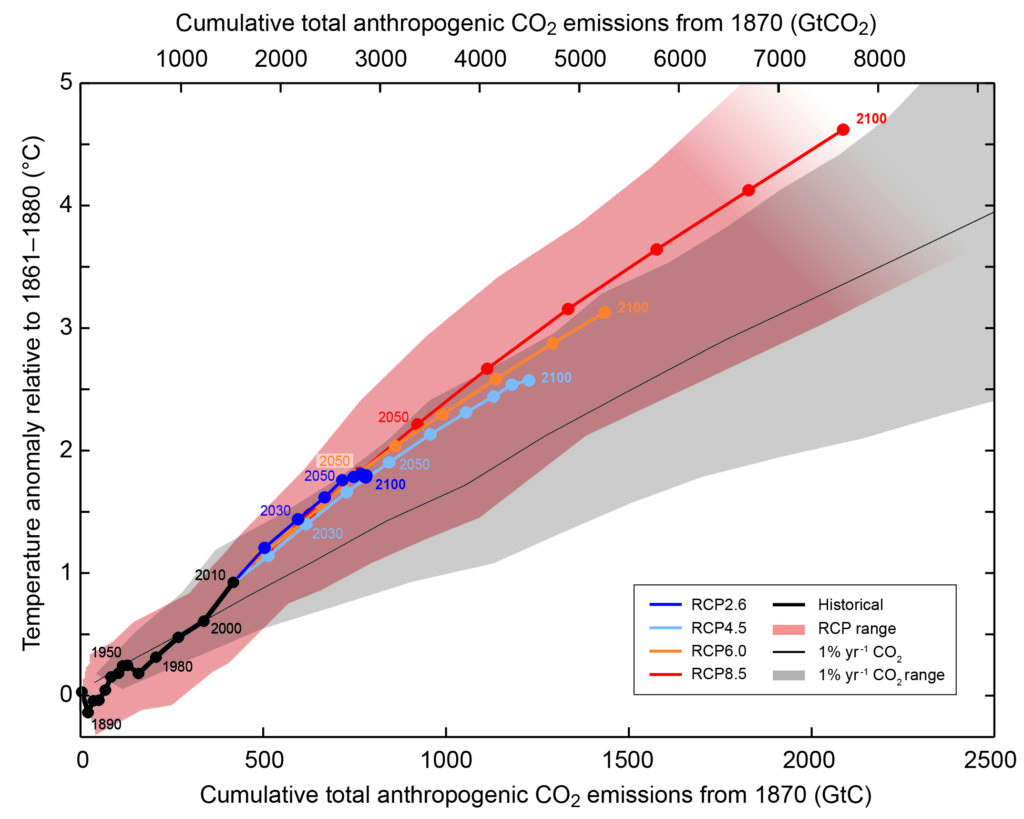
To simplify this complex picture, scientists have concluded that there is a relatively direct relationship between the sum of all CO2 emissions from pre-industrial times until we cease producing them and how strong the eventual global warming will be. See Figure 2. Based on this, it is possible to estimate the level of future warming, under a given assumption about future emissions of CO2 – and thus, as we will see, also how significant the climate risk will be. The key message, however, is this: All emissions affect the climate from the moment they are released into the atmosphere, but some – especially CO2– also have a long-term effect.
The long-term evolution of climate change depends on how emissions continue to progress, and whether we at some point in the future develop technology or actively manage the environment in such a way as to remove greenhouse gases from the atmosphere on a large scale. As of today, all the scenarios applied by the IPCC in SR15, and where we remain within the goals of the Paris Agreement, depend on such technology or management in the second half of this century. This will require significant upscaling, development, and improvements of technology. Not even the most climate-optimistic scenarios, where human-made greenhouse gas emissions and carbon uptake are in balance already in 2050 and emissions turn negative with the help of technology thereafter, show a notable reduction in the global temperature below 1.5 to 2.0 degrees before 2100. Higher emission scenarios show continued warming for several hundred years. The natural carbon cycle, along with any form of technological or otherwise elevated atmospheric carbon removal, will drive the temperature down again in the long term, but only in a situation where anthropogenic emissions are net zero or negative. Technological carbon removal to reduce temperatures must therefore come in addition to that used to offset residual anthropogenic emissions. Climate change can therefore be considered permanent and irreversible on all timescales relevant to social and political development.
2.4. From climate change to climate risk
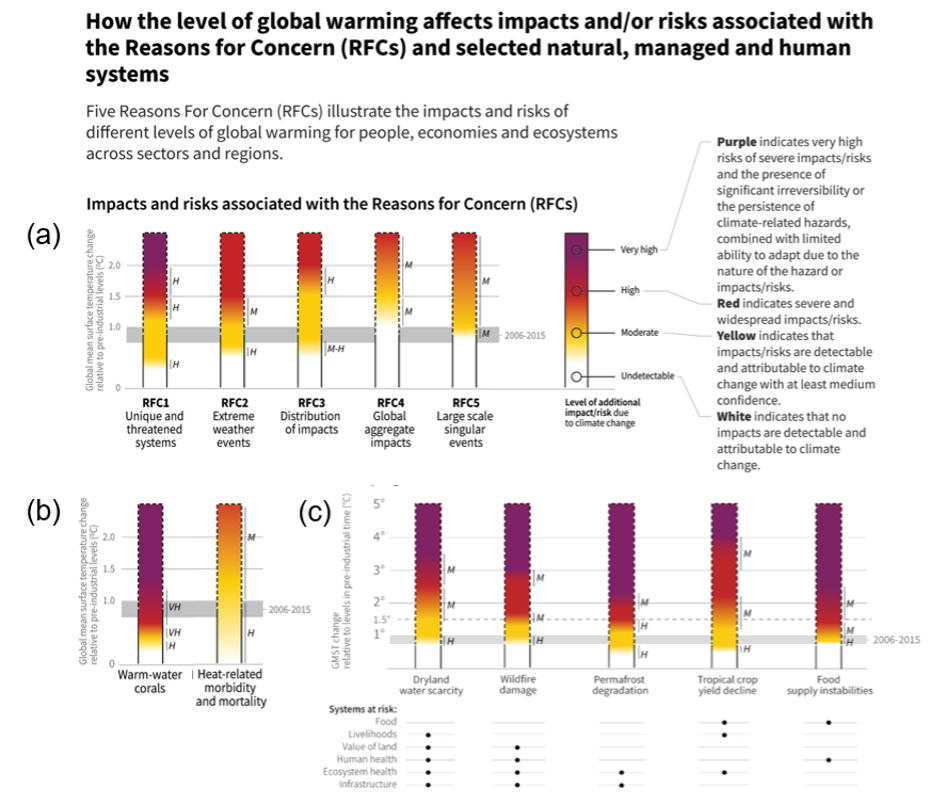
When current emissions have now been linked to continued climate change, the next step is to link climate change to climate risk. Today, this is often done through so-called “burning ember” charts; coloured columns where the level of global warming increases upwards, and the darker colour indicates higher risk. See an example in Figure 3, taken from two of the IPCC’s special reports from 2018 and 2019. At the end of the chapter we include the summary figures on risk from all three special reports. Together, they provide a thorough picture of how climate risk for different human and natural systems increases with the degree of warming.
Figure 3 has three parts. Part (a) and (b) are from the Special Report on 1.5-degree warming. Part (a) shows an overall risk assessment for aggregated changes, such as extreme weather and particularly harmful individual events. Part (b) shows more detailed assessments of the impact of climate change on coral reefs and on heat-related disease and death in humans. Part (c) is from the Special Report on Climate Change and Land, and shows risks related to water shortages in dry areas, large fires, loss of permafrost, failed harvests in tropical areas and unstable food supply. Below part (c) is an indication of which foundations of society is most at risk: food, livelihood, health etc. Note that the columns here extend to greater warming than in parts (a) and (b). (See also the appendices for the full figures.)
There are two overarching messages in these figures. The first is that the risk steadily increases with global warming, sometimes faster, other times somewhat slower. The second is that for the current level of warming (calculated for the period 2006–2015), indicated by the grey horizontal band, moderate climate risk has already been established in most cases. We are therefore already in a situation where climate change poses challenges for nature, society, health and life, in the form e.g. of fires and heatwaves. Any further warming, from further emission of greenhouse gases or other causes, will heighten this risk. In many cases, two degrees of global warming could be enough to move us into the high-risk area, defined as “severe and widespread impacts/risks”, where risks include irreversible consequences such as tipping points in the climate system (e.g. self-reinforcing emissions of methane from tundra in the north, or changes to global ocean currents).
2.5. Society’s impact on risk
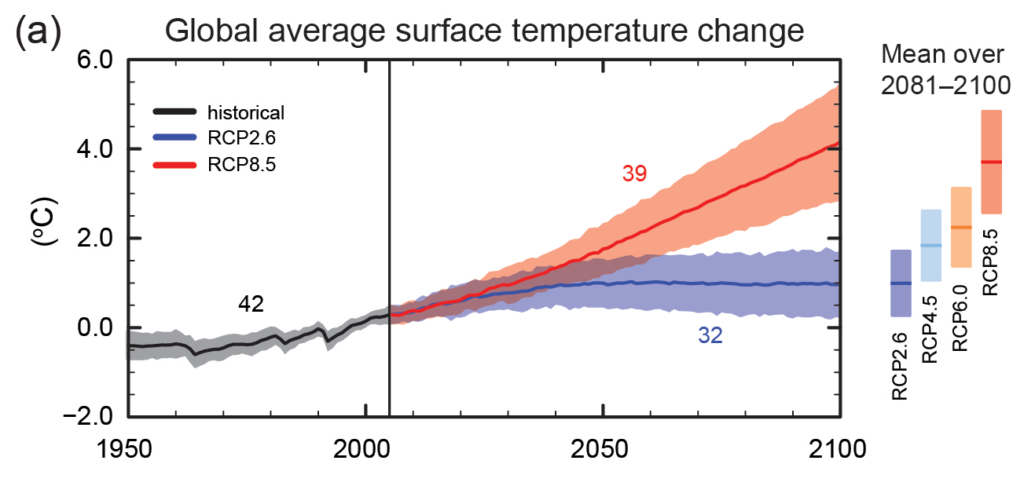
As mentioned above, climate risk is determined by three factors: physical climate changes, exposure and vulnerability. The physical changes are largely determined by how warm it gets, and consequently by how much greenhouse gases we emit in the future. Figure 4 shows the span of temperature development up until 2100 in the scenarios used in IPCC AR5. Here, RCP8.5 is an assumption of continued high, and increasing, greenhouse gas emissions (with an associated CO2 concentration in 2100 of around 1200 ppm), while RCP2.6 (CO2 concentration in 2100 of 400 ppm) assumes reductions that overall are in line with the ambitions of the Paris Agreement. The figures are relative to the average of temperatures in 1986–2005, where global warming was already at 0.61 °C. In order to arrive at total warming from pre-industrial times, this number must therefore be added. The figure shows that we can expect warming between 2.0 and 4.5 °C by 2100, as the two scenarios shown can be roughly considered the upper and lower range of what might happen to emissions. By comparison, scientists estimate that the future emission cuts announced by the world’s nations before the Paris Agreement would have resulted in a warming of around 3°C by 2100 (relative to 1850–1900), if successfully implemented but not further strengthened.16NB: These scenarios look only at man-made emissions and the expected behaviour of the carbon cycle, and do not include any abrupt feedback/tipping points. These, however, are included in the other parts of the risk assessments below.
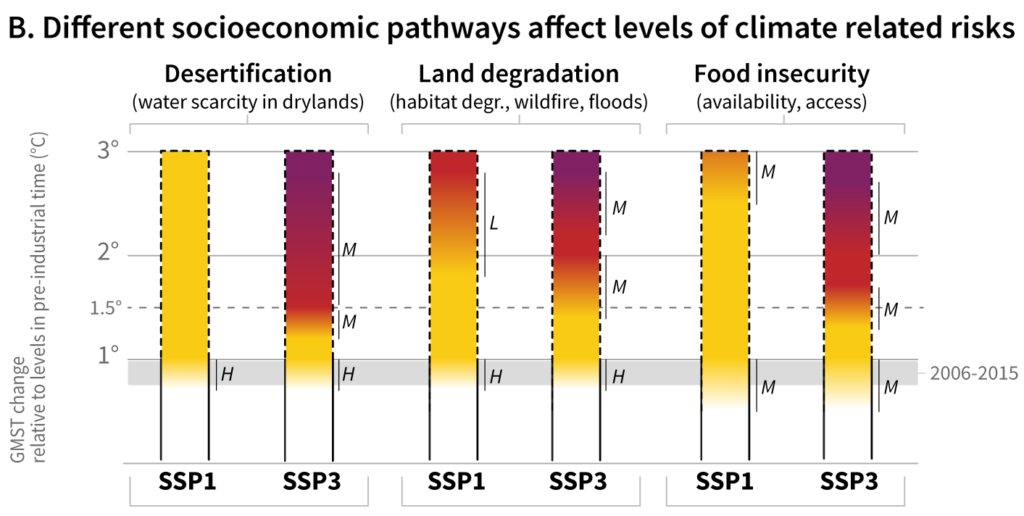
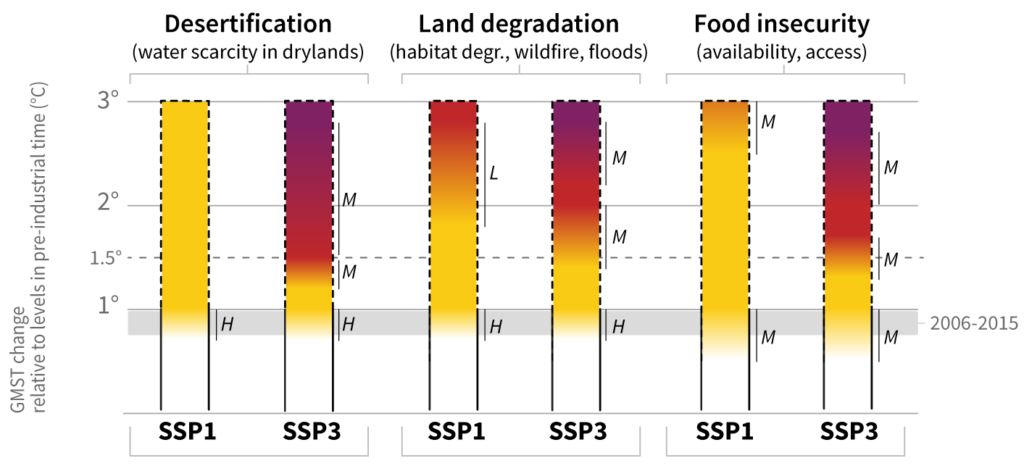
The risk, especially exposure and vulnerability, is nevertheless also affected by societal factors. In later reports, the IPCC has used scenarios that describe possible future socioeconomic developments, in addition to emissions and climate change. Studies of these show that even for the same degree of warming, and thereby comparable physical changes, the climate risk will be significantly lower in a society characterised by international cooperation and sustainability than in a world with a high degree of conflict and resource use. At the same time, socioeconomic development alone is not sufficient to avoid elevated climate risk. See Figure 5, which also describes the two illustrative scenarios for socioeconomic development (called SSP1 and SSP3).
2.6. Norwegian emissions and Norwegian risk
Climate change is a global issue. Emissions of greenhouse gases such as CO2 and methane disperse throughout the entire atmosphere, regardless of their origin, causing changes both locally and globally. Climate risk in any given place, such as Norway, therefore depends on the degree of global warming, on which physical changes are most prominent regionally and locally, and on how exposed and vulnerable society is where they occur. For Norway, extreme rain, floods, landslides, wildfires, migration of new species and diseases and agricultural challenges have been mentioned, but this list is not exhaustive. Furthermore, Norway is also vulnerable to risks associated with major changes abroad, affecting trade, security and international relations. Quantifying Norway’s climate risk in detail is an ongoing activity among scientists, authorities and corporations.17Se e.g. https://klimaservicesenter.no/faces/desktop/index.xhtml.
In 2019, 42 million tonnes of CO2 were emitted from Norwegian territory (total greenhouse gas emissions of 50 million tonnes of CO2 equivalents).18SSB 2020, https://www.ssb.no/klimagassn/. This represents approximately 0.12% of the total man-made CO2emissions of 36 trillion tonnes of CO2 that same year.19Global Carbon Project 2019, www.globalcarbonproject.org/carbonbudget. In comparison, the burning of oil and gas extracted from Norwegian territory and sold abroad causes approximately20Figures for 2019, based on estimates from the Global Carbon Project (see previous note). ten times as much emissions, which is more than 1% of the global total. Emissions directly from Norwegian territory, and from use of the oil and gas Norway produces, both contribute to increasing climate risk – globally and locally.
2.7. Additional figures
Risk chart from IPCC’s three special reports from 2018 and 2019:
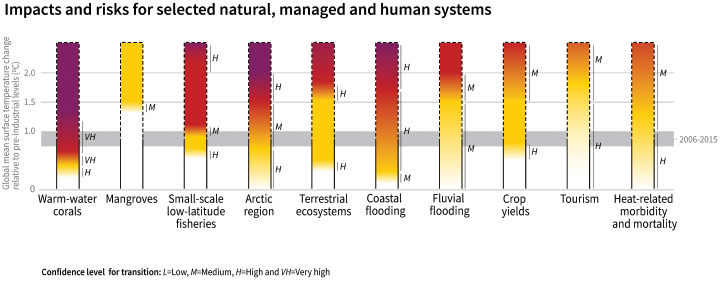
How the level of global warming affects impacts and/or risks associated with the Reasons for Concern (RFCs) and selected natural, managed and human systems21Special Report: Global Warming of 1.5 °C (IPCC SR15).
Five Reasons For Concern (RFCs) illustrate the impacts and risks of different levels of global warming for people, economies and ecosystems across sectors and regions.
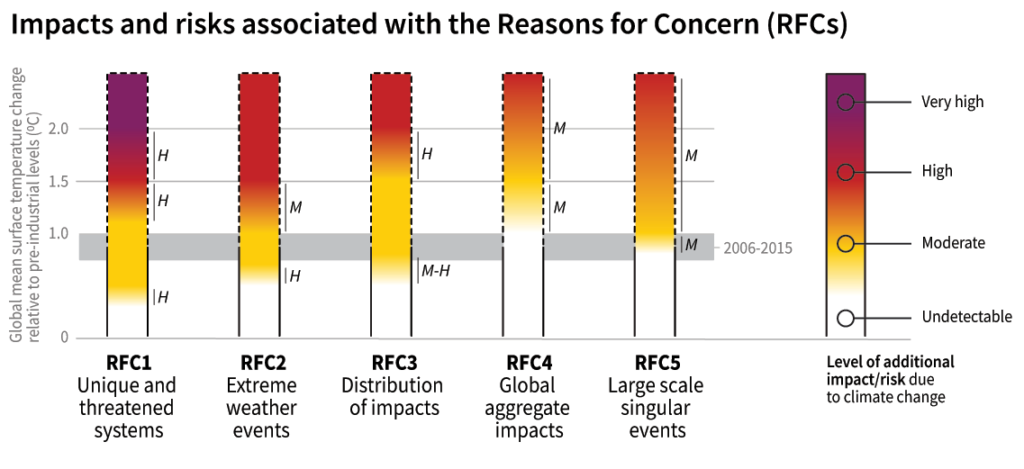
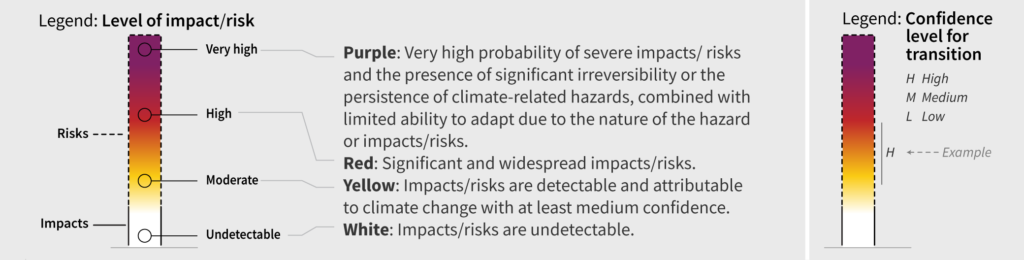
Red indicates severe and widespread impacts/risks.
Yellow indicates that impacts/risks are detectable and attributable to climate change with at least medium confidence.
White indicates that no impacts are detectable and attributable to climate change.
A. Risks to humans and ecosystems from changes in land-based processes as a result of climate change22Special report on Climate Change and Land(IPCC SRCCL)
Increases in global mean surface temperature (GMST), relative to pre-industrial levels, affect processes involved in desertification (water scarcity), land degradation (soil erosion, vegetation loss, wildfire, permafrost thaw) and food security (crop yield and food supply instabilities). Changes in these processes drive risks to food systems, livelihoods, infrastructure, the value of land, and human and ecosystem health. Changes in one process (e.g. wildfire or water scarcity) may result in compound risks. Risks are locationspecific and differ by region.
B. Different socioeconomic pathways affect levels of climate related risks23Special Report on Climate Change and Land(IPCC SRCCL)
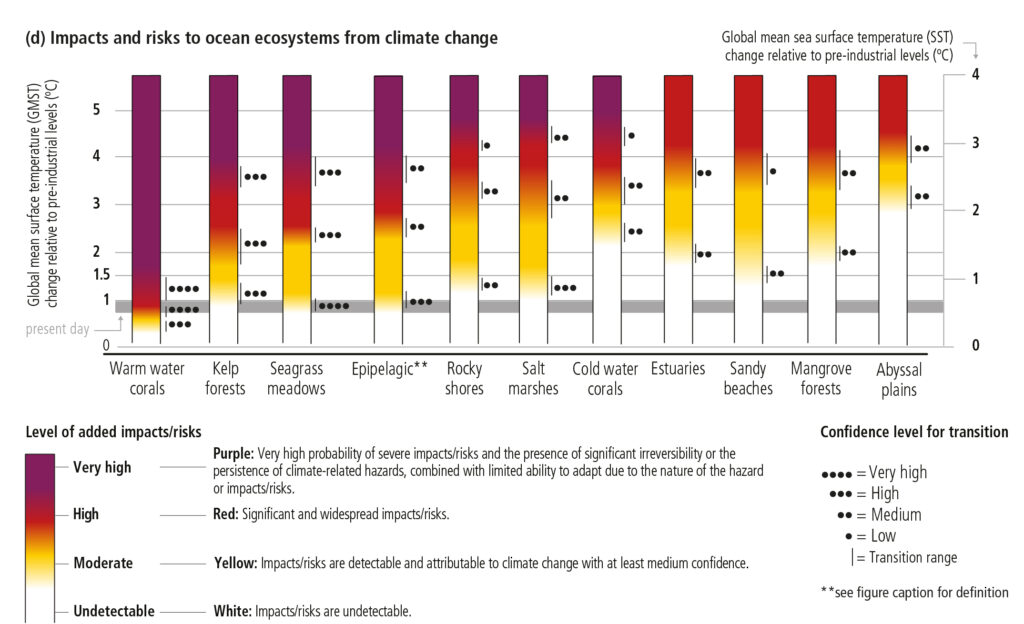
(d) Impact and risks to ocean ecosystems from climate change24Special Report on the Ocean and Cryosphere in a Changing Climate (IPCC SROCC)